Blue lines on Tencent Maps
Date: 2024-12-23
Last time, we documented how to find and work with Tencent Street View panoramas. Read about that in the previous post. But we didn't figure out how the blue lines work that are visible in the QQ Maps mobile app.
After a few days of Ghidra spelunking, it turns out it's using a very bespoke system!
Starting the investigation
The QQ Maps app makes request of this shape:
https://mapvectors.map.qq.com/mobile_street?df=1&idx=1013&lv=13&dth=20&bn=1&bl=35So let's figure out what the parameters mean and what it responds with.
I started by decompiling the QQ Maps APK using apktool. It extracts all the files from the APK and translates the compiled JARs to a language called Smali, which is a... relatively human-readable way to represent Android bytecode.
I searched the source code for mentions of mobile_street, and just street, and soon found that QQ Maps calls into a C++ library for all the actual map rendering.
invoke-static {v0, v1, p1}, Lcom/tencent/mapsdk2/jni/TXMapJni;->nativeSetStreetViewVisible(JZ)VThere's probably a simple way to find out what library is used by TXMapJni, but I pretty much looked through the .so files in the lib/ folder extracted by apktool and clicked the first file name that made sense, which was libtxmapsdk.so.
I spent a few hours on this but eventually got a bit stuck because the decompilation wasn't very readable. I remembered when I worked on reverse engineering Age of Empires 2 how much easier it was to work with the old versions from 1999 compared to the newer versions... So I downloaded the oldest QQ Maps APK I could easily find (6.8 from May 2017). This isn't a huge time difference, but the difference in decompilation was major. There were names for many more functions, and in general the decompilation seemed simpler.
"Street config"
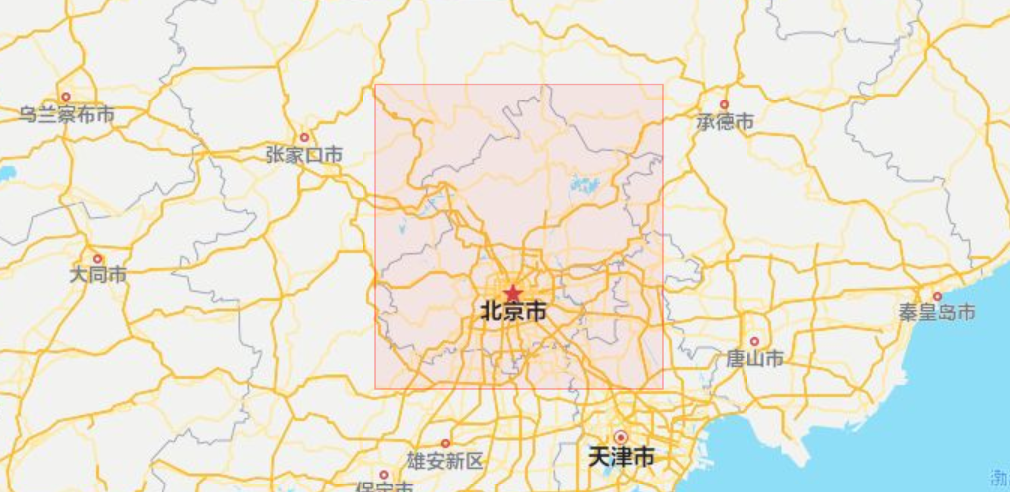
The first thing we noticed is that idx appears to correspond to cities. For example, all lines in Beijing have idx=1001.
The QQ Maps APK ships with a file called streetcfg.dat. This file contains a list of region IDs, names, and bounding boxes.
{
  "idx": 1001,
  "date": 20150227,
  "name": "beijingshi",
  "nameCn": "北京",
  "bbox": [
    220268405,
    100584279,
    221835344,
    102245659
  ]
},
Of course, it isn't actually stored as JSON, but in a compact, custom binary representation. I'll use a C-like syntax to describe the structures.
The first 8 bytes are a header:
- A 4-byte signature, reading the string
TXVN. - A 4-byte integer representing a date (
20160804).
struct Header {
  char signature[4];
  int date;
}
Then, 2 bytes indicating the number of tile sizes, followed by that many 4-byte integers:
struct TileSizes {
  short num_levels;
  int sizes[num_levels];
}
The tile sizes are in the same unit as the bbox values we'll interpret a bit further down. There's one tile size for each zoom level, and we'll use the tile sizes to compute how many tiles make up a coverage area.
This is followed by another 2 bytes indicating the number of coverage areas, and then that many coverage areas:
struct CoverageAreas {
  short num_areas;
  struct CoverageArea areas[num_areas];
};

struct CoverageArea {
  short id;
  int date;
  short name_pinyin_len;
  // Character encoding: ASCII
  char name_pinyin[name_pinyin_len];
  short name_len;
  // Character encoding: UTF-16-LE
  short name[name_len];
  int bbox[4];
}
Finally, there's a CRC checksum at the end of the file.
More, different coordinates
We now have several hundred coverage areas with bounding boxes. But what are these bounding boxes?
[220268405, 100584279, 221835344, 102245659]I first tried to convert these coordinates with the functions described in the previous post.
[1978.704748, 89.999983, 1992.780801, 89.999987]Okay, that doesn't really look like a GCJ-02 coordinate to me. The map tiles use their own coordinate system. I looked through all the exposed JNI functions and stumbled upon this:
p_Var2 = (_jfieldID *)_JNIEnv::GetFieldID(env,p_Var1,"mLatitudeE6","I");
p_Var3 = (_jfieldID *)_JNIEnv::GetFieldID(env,p_Var1,"mLongitudeE6","I");
mLatitude = _JNIEnv::GetIntField(env,object,p_Var2);
mLongitude = _JNIEnv::GetIntField(env,object,p_Var3);
FUN_00073728(SUB84((double)(longlong)mLongitude / 1000000.0,0),param_2,
             SUB84((double)(longlong)mLatitude / 1000000.0,0),local_88);
FUN_00073628(local_88[0],param_2,local_80,&local_90);
GLMapGetCityName(uVar5,local_90,local_8c,asStack_78,100);
This looks a lot like it might be converting a latitude and longitude into some other coordinate system!
The second function call, FUN_00073628, contains some familiar constants:
uVar2 = SUB84((in_d1 + 90.0) * 0.008726646259971648,0);
tan(in_d0);
log(in_d0);
*param_1 = (int)(longlong)(((in_d0 + 180.0) / 360.0) * 268435456.0);
param_1[1] = (int)(longlong)
                  (((180.0 - (double)CONCAT44(extraout_r1,uVar2) / 0.017453292519943295) / 360.0)
                  * 268435456.0);
The 0.0174... value is PI / 180: a radians to degrees conversion. The 0.00872 value is 1 divided by the A constant from the previous post. The transformation looks really similar, with some tweaks, and a new constant value 268435456.
Because the decompiler didn't do a great job with this function, I searched all the Tencent JS SDKs for this constant, and bingo, there is a JavaScript implementation of this function already :) Cleaning it up gives:
type PixelCoord = [x: number, y: number]
type Gcj02Coord = [lng: number, lat: number]

/** Unknown constant */
const A = 114.59155902616465
/** World size for tencent pixels coordinates */
const PX_SCALE = 268435456

function deg2rad (deg) {
  return deg * Math.PI / 180
}

function rad2deg (rad) {
  return rad * 180 / Math.PI
}

/** Translate a tencent pixel coordinate to GCJ-02. */
export function pixelsToGcj02([x, y]: PixelCoord): Gcj02Coord {
  const lng = (360 * x) / PX_SCALE - 180
  const lat = Math.atan(Math.exp(deg2rad(180 - (360 * y) / PX_SCALE))) * A - 90
  return [lng, lat]
}

/** Translate a GCJ-02 coordinate to a tencent pixel coordinate. */
export function gcj02ToPixels([lng, lat]: Gcj02Coord): PixelCoord {
  const x = (lng + 180) * PX_SCALE / 360
  const y = (PX_SCALE / 360) * (180 - rad2deg(Math.log(Math.tan((lat + 90) / A))))
  return [x, y]
}
And our bounding box becomes:
[115.40295079350471, 41.05985054867162, 117.5043797492981, 39.358430009349036]
That looks like Beijing to me.
Building a URL
idx
We can find the idx(es) for an area by converting coordinates from a latitude and longitude to tencent pixel coordinates, and searching the streetcfg for overlapping bounding boxes.
lv
The lv is the zoom level. Zoom levels are also bespoke and a bit weird. Tencent distinguishes between display levels and data levels.
The display level is, I think, the same as in a typical slippy map. To convert the display level to a data level, we have to do:
const DATA_LEVELS = [11, 11, 12, 13, 14, 18, 18, 18, 18, 18]
function displayLevelToDataLevel (displayLevel: number) {
  if (displayLevel < 10 || displayLevel >= 19) {
    return null
  }
  return DATA_LEVELS[displayLevel - 10]
}
This is all a bit weird, but it means that you "can't" load street view tiles until you're at slippy map zoom level 10, and you can only request tiles at zoom levels 11, 12, 13, 14, and 18.
bl
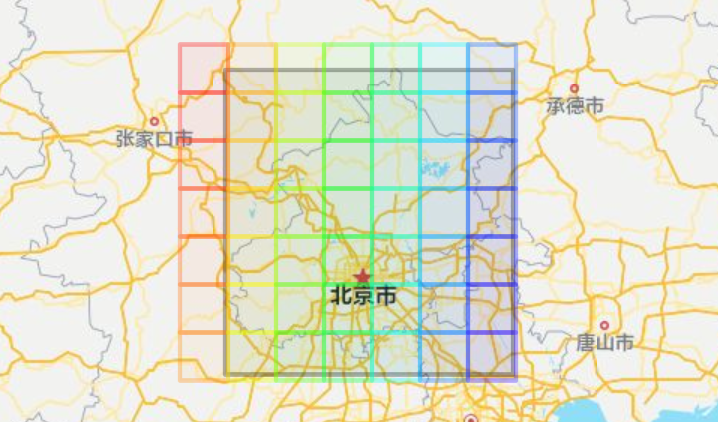
The bl is a tile index. Tencent Maps calls tiles blocks, but I call them tiles. The tile index fills the bounding box of the idx coverage area by increasing north to south, west to east. So tile 2 is below tile 1, and it wraps around when the full height of the bounding box is filled.
1  5  etc..
2  6  etc..
3  7  etc..
4  8  etc..
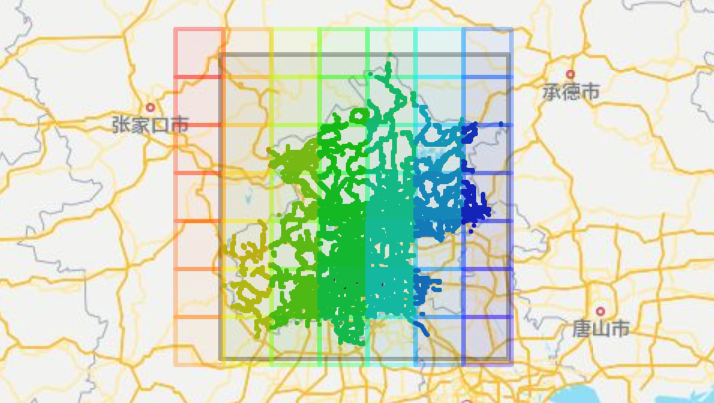
Colouring each tile along the rainbow, starting from index 0, gives this:

The bounding box of Beijing is displayed in grey. The tiles are aligned on their own grid, and some only intersect with Beijing's bounding box a little bit.
Downloading every tile
To be honest, I haven't tried to render tiles directly onto a map using this endpoint, though it should be possible. You just have to jump through a bunch of hoops to put together the right URLs for your viewport. The tiles also don't line up with slippy map tiles.
Instead, I decided to download all tiles for each city first, and convert them into a format that's much easier to use.
To download all tiles, we need to know how many tiles there are for a given zoom level, and then we can just request each of them from 0 through the highest tile index.
We can calculate the amount of tiles based on the area of the bounding box.
type BBox = [west: number, north: number, east: number, south: number]
function getTileCount (bbox, dataLevel: number) {
  const tileSize = streetcfg.tileSizes[dataLevel - 10]
  const west = Math.floor(bbox[0] / tileSize)
  const north = Math.floor(bbox[1] / tileSize)
  const east = Math.floor((bbox[2] - 1) / tileSize)
  const south = Math.floor((bbox[3] - 1) / tileSize)

  const width = (east - west) + 1
  const height = (south - north) + 1

  return width * height
}
For Beijing:
getTileCount([220268405, 100584279, 221835344, 102245659], 11)
// -> 49
And then we can just fill in 0 through 48 in the bl parameter to download everything.
Vector tiles
The tile contents are also a completely bespoke format. Each tile contains lines encoded as pixel coordinates, relative to the bounding box of the tile.
The first 30 bytes of each tile are a header:
┌────────┬─────────────────────────┬─────────────────────────┬────────┬────────┐
│00000000│ e9 03 00 00 0b 00 00 00 ┊ 00 54 58 56 4e d3 77 33 │ו⋄⋄•⋄⋄⋄┊⋄TXVN×w3│
│00000010│ 01 a1 21 03 00 00 07 00 ┊ 00 00 0f 70 a1 9a       │•×!•⋄⋄•⋄┊⋄⋄•p××  │
└────────┴─────────────────────────┴─────────────────────────┴────────┴────────┘
struct TileHeader {
int idx;
char level; // The data level
int tile_index; // The `bl` parameter
char signature[4]; // "TXVN"
int date;
int _file_offset;
char _unknown;
int body_size;
}I didn't look much into what the _unknown property is for. The _file_offset is used to place the tile data in a local filesystem cache. That's very particular to how the QQ Maps app works, and it's really not relevant.
The body of the tile starts at byte 32. It's compressed with "raw" DEFLATE. In Node.js you can do:
import { inflateRawSync } from 'node:zlib'

const body = inflateRawSync(vectorTileBytes.slice(32))
This body once again starts with a header:
struct TileBodyHeader {
  int tile_index; // Repeated from TileHeader...
  char level; // Repeated from TileHeader...
  short num_layers;
}
This vector format contains, I think, layers, though for the street view coverage tiles, there's always only one.
Each layer is made up of features, and a feature is made up of points. For street view coverage tiles, all features are equivalent to GeoJSON LineStrings. I think the format is also used for other types of features, like polygons, but those are never used in the street view tiles.
A layer starts with yet another header:
struct LayerHeader {
  short _unknown;
  short num_features;
  struct FeatureDescr features[num_features];
};

struct FeatureDescr {
  short num_points;
  short _unknown; // Maybe a feature type value?
};
After this, we get all of the points in the entire layer. To associate points with the correct feature, you have to keep track of the amount of points you've read. To simplify the code examples below, which are already pretty complex, I'm going to ignore that part and leave it as an exercise for the reader.
Points can have relative or absolute values. A relative point uses only one byte to encode the x and y coordinates, and it's treated as relative to the previous point. An absolute point uses 2 or 3 bytes to encode the x and y coordinates, depending on the zoom level. Also, the x and y values are not the actual tencent pixel value, but need to be multiplied by a constant, again depending on the zoom level. All of this does result in a pretty efficient encoding, but you need a crap-ton of context to make sense of it!
The very first point for a layer is always an absolute point. After that, there is a mix of relative and absolute points. Absolute points after the first one are marked by a byte with value 127.
// Use the JavaScript DataView API
declare const body: DataView
// We'll figure this out in a second
declare const pointSize: number
declare function readAbsolutePoint (body: DataView, offset: number): {
  x: number,
  y: number,
}

let prevPoint = readAbsolutePoint(body, offset)
offset += pointSize

const points = [prevPoint]

while (offset < body.byteLength) {
  if (body.getUint8(offset) === 127) {
    prevPoint = readAbsolutePoint(body, offset)
    points.push(prevPoint)
    offset += pointSize
  } else {
    // Add the x, y values to the previous point.
    const x = body.getInt8(offset)
    const y = body.getInt8(offset + 1)
    offset += 2
    prevPoint = {
      x: prevPoint.x + x,
      y: prevPoint.y + y,
    }
    points.push(prevPoint)
  }
}
Now we have our points. We just need to account for the final two complications, point size and multiplier. I can't explain the code that the QQ Maps app uses here, I can only show it:
const COMPRESS_LEVEL = [7, 11, 11, 11, 11, 11, 11, 11, 11]
const tileSize = streetcfg.tileSizes[dataLevel - 10]
const compressLevel = COMPRESS_LEVEL[dataLevel - 10]
const multiplier = Math.floor(tileSize / (1 << compressLevel))
const pointSize = (compressLevel + 1) / 4
...sure. Now we can implement readAbsolutePoint:
function readAbsolutePoint (body: DataView, offset: number) {
  if (pointSize === 2) {
    // 2-byte absolute point--this is the same size in bytes as a relative point,
    // but the bytes are unsigned, so it can encode larger numbers.
    return {
      x: body.getUint8(offset),
      y: body.getUint8(offset + 1),
    }
  } else if (pointSize === 3) {
    // 3-byte absolute point.
    // Essentially, x and y are stored as 12 bit integers.
    const value = body.getUint8(offset)
      | (body.getUint8(offset + 1) << 8)
      | (body.getUint8(offset + 2) << 16)
    return {
      x: (value & 0x000FFF),
      y: (value & 0xFFF000) >> 12,
    }
  } else {
    throw new Error('unknown pointSize')
  }
}
Finally, we can get pixel coordinates by multiplying all our points values by the multiplier, and offsetting them to the coverage area's bounding box:,
for (const point of points) {
  point.x = bbox[0] + points.x * multiplier
  point.y = bbox[3] + points.y * multiplier
}
And then GCJ-02 coordinates using the conversion function:
const coords = points.map((point) => {
  return pixelsToGcj02([point.x, point.y])
})
And now we're finally done.

Making it actually usable
As I said, I am not actually using the tiles directly on a map. Instead, I figured I'd convert them to mapbox vector tiles, a common format with lots of available tooling.
I downloaded all tiles for every coverage area at the maximum zoom level, 18. I formatted each area as a GeoJSON collection of LineStrings. Then I gave all the files to tippecanoe, which produces a single pmtiles archive that can easily be hosted with any static file server.
tippecanoe -zg \
  --drop-densest-as-needed \
  --extend-zooms-if-still-dropping \
  -l sv \
  -o lines.pmtiles \
  areas/*.json
I arrived at those command-line options through a bit of experimentation, and although it's not perfect (a little too dense for my taste when you zoom out), the result is really quite good.
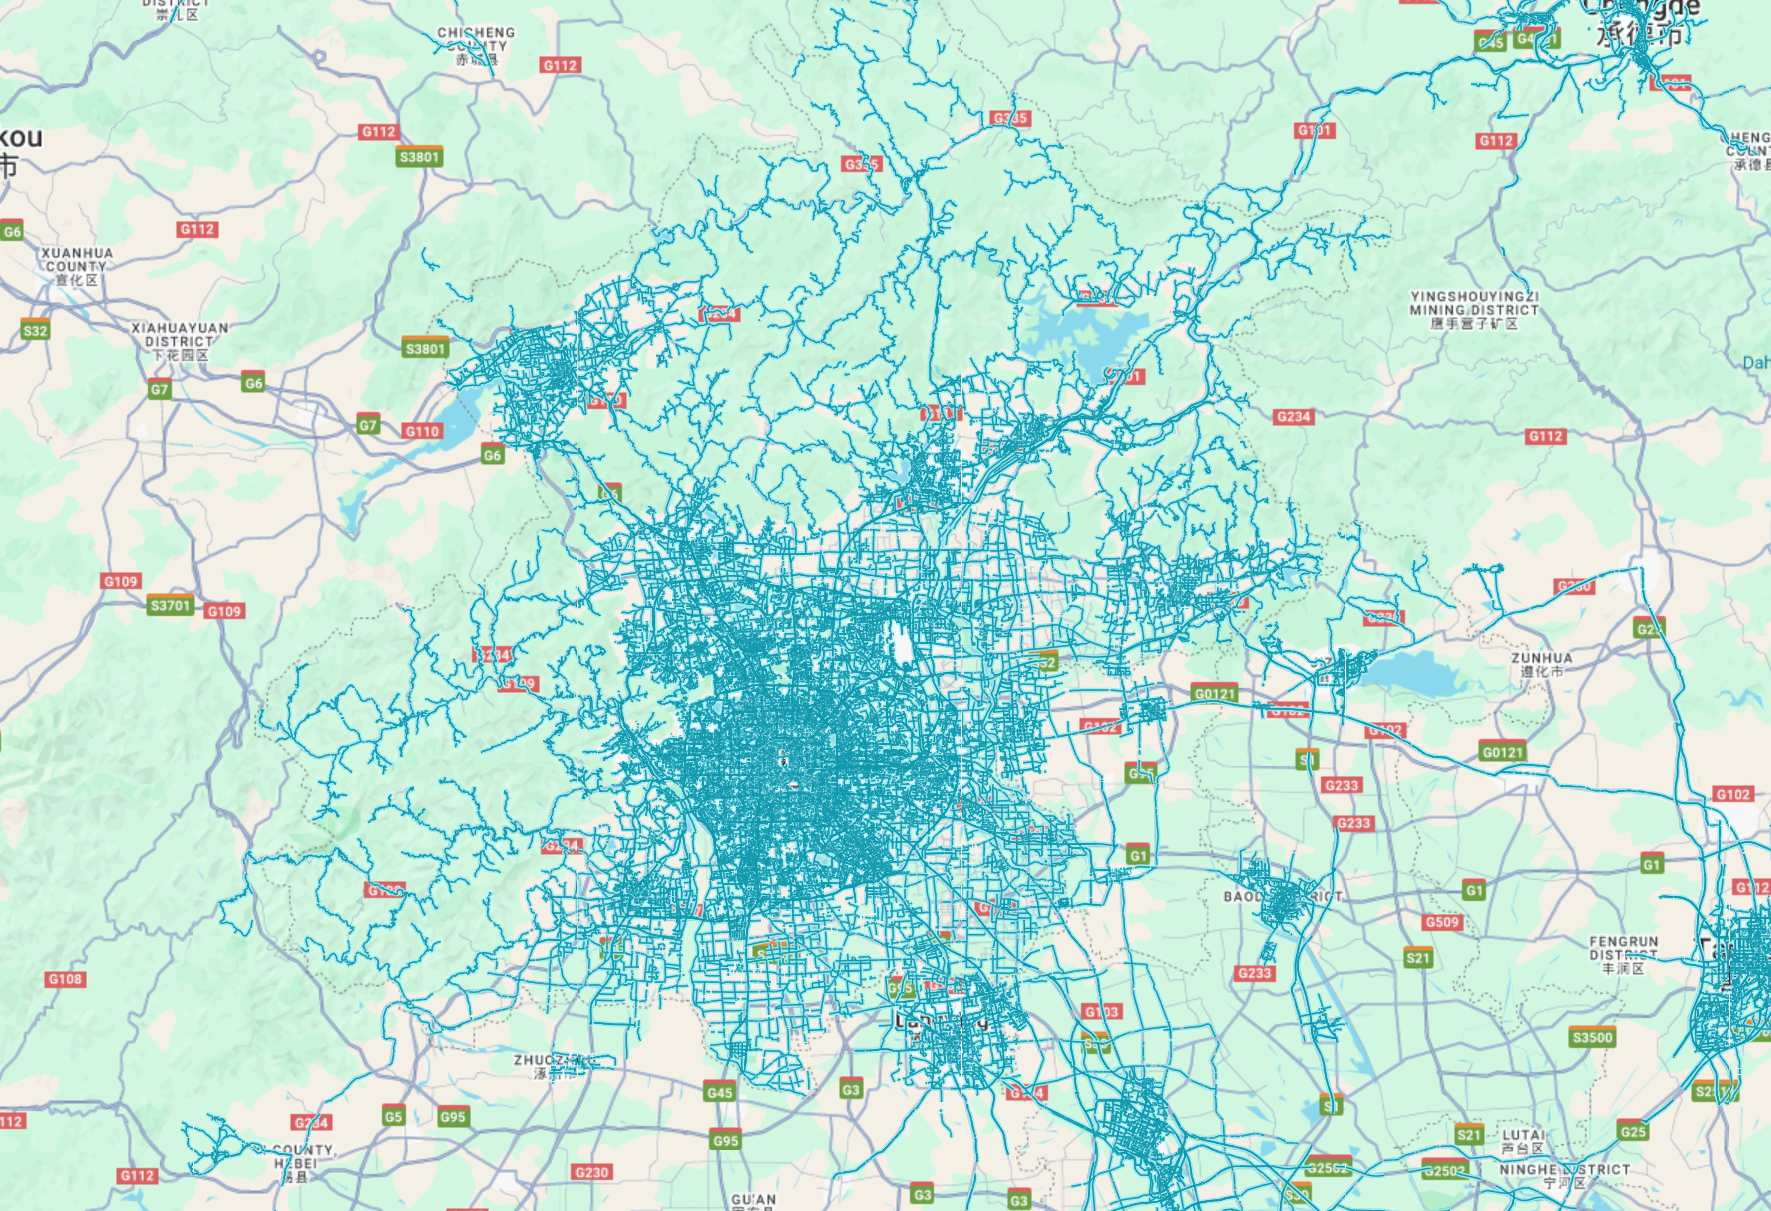
The tiles can be rendered with any Mapbox Vector Tile library, and styled at runtime. Here is Beijing using a style similar to Google Street View's blue lines:

Conclusion
Big thanks to the Tuxun developer community, kakageo, and ktz from Virtual Streets for their help and for sharing their research.
The final product of this work is now live on qq-map.netlify.app. You can click anywhere on the map to enter street view (where available).